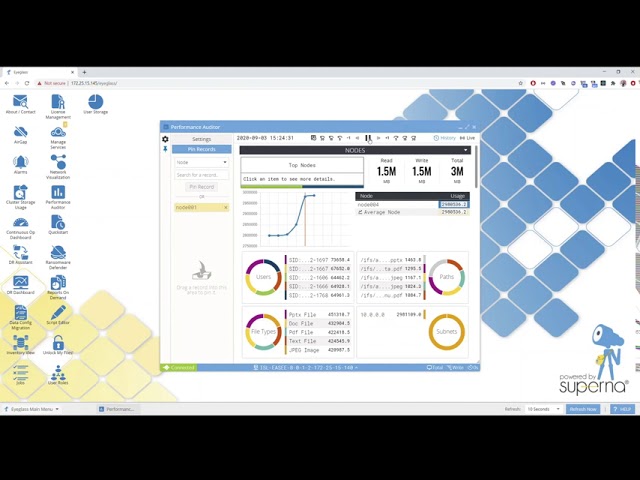
Eyeglass Performance Auditor
Now Generally Available
Eyeglass Performance Auditor Rewind Feature Overview


Eyeglass Performance Auditor Rewind Feature Overview

Eyeglass Performance Auditor Read and Write Ratio's

Eyeglass Performance Auditor Overview Live Cluster Demo

Eyeglass Performance Auditor Overview
The Performance Auditor module simplifies answering tough performance questions for Scale out NAS. “Why is the NAS slow today?”
Scale out NAS and scale out Object storage introduces challenges to monitor performance across all nodes in a cluster. User file IO requests can move between nodes, busy file system paths may not be balanced and user subnets can cause unbalanced IO across the cluster. When a performance issue popups up you need answers fast.
Problem Statement:
-
Users questions "The NAS is slow today"
-
Application transactions are not normal
-
Long login times reported by users
The Eyeglass module provides real-time file IO view of Isilon nodes to simplify root cause of performance impacts, assessing changes needed to optimize performance and debugging user, network and application performance.
Answer user questions about performance.
-
Why is the NAS slow?
-
Why is the object store slowing down?
-
My applications are not processing transactions normally
-
Why is login taking forever today?
-
Answer questions about your cluster load balancing configuration
-
Root cause business impacting performance issues
Application Aware Performance Monitoring Delivers:
-
Better Insight to your workloads
-
How change affects your workloads
-
How to optimize your Scale out NAS for maximum performance
Key Features
-
Real time view of node by node user and application IO
-
Isilon and Dell ECS object support
-
Historical reply of real-time data allows trouble shooting issues in the past. Performance Auditor stored time series data for play back, pause and rewind of performance data
-
Object , bucket, name space, user, ECS node, subnet performance awareness makes managing object performance possible
-
Calculates node impact by analyzing user file IO behavior and summarizes node impact visually
-
Computes a summary of key performance indicators per Isilon node:
-
Top Users
-
Top File IO
-
Top Applications
-
Top Subnets
-
Read/Write ratio by path, file, subnet, node
-
Pin a user, path, subnet and node to compare against top resource consumers
-
Object Performance Monitoring

